A low emission zone stops the more polluting vehicles travelling in an area and reduces pollution. Low emission zones can have a significant impact on air pollution. However, they often do not solve the problem alone. Other measures are also needed.

Electric car van charging and charging point 
Factory plumes emitting

Most European cities have Air Quality Action Plans to improve air quality. They often include implementing a low emission zone, as one of the single most effective measures. What is included an air quality action plan will depend on the most significant sources of pollution in the city and how they can be reduced. The city action plan works together with national, regional and EU measures.

Action on pollution is taken at the appropriate level, local, regional, national, Europe and world wide. 

Local measures for road traffic

Local measures for other pollution sources

Measures often taken at a national level or regional level

European and international measures


Examples of local measures for road vehicles:

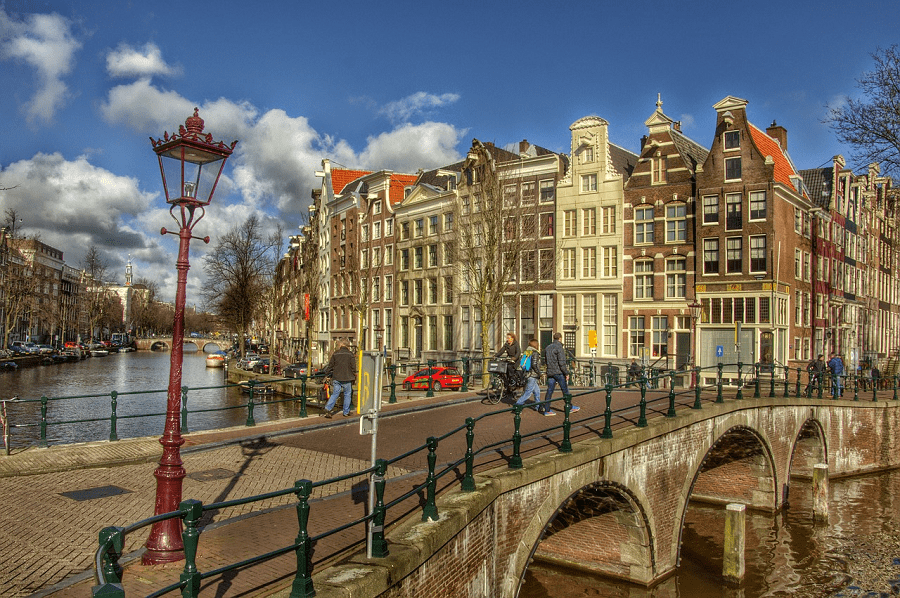
  • Measures to reduce the amount of traffic. And measures to improve other travel options. These include good and clean public transport, good cycle facilities, low emission car sharing schemes or appropriate town planning.
  • City road tolls, or access regulations for different vehicles or trips to reduce the amount of traffic. This also means that those who need to travel by motor vehicle can move better.
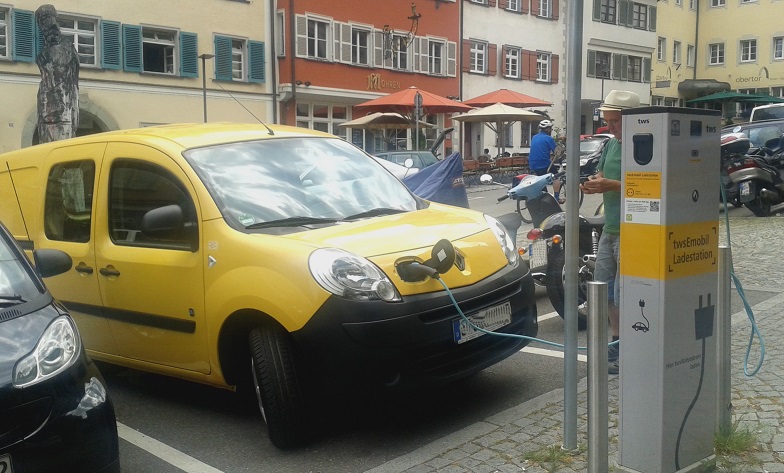
  • Incentives for cleaner vehicles. For example reduced road tax, cheaper road tolls, grants for electric or hybrid vehicles, cheaper or available parking.
  • Smoothing traffic flow, for example by synchronising traffic lights
  • Reducing speed limits on faster roads. This can improve traffic flow as well as making sure the vehicles travel at a cleaner and more efficient speed
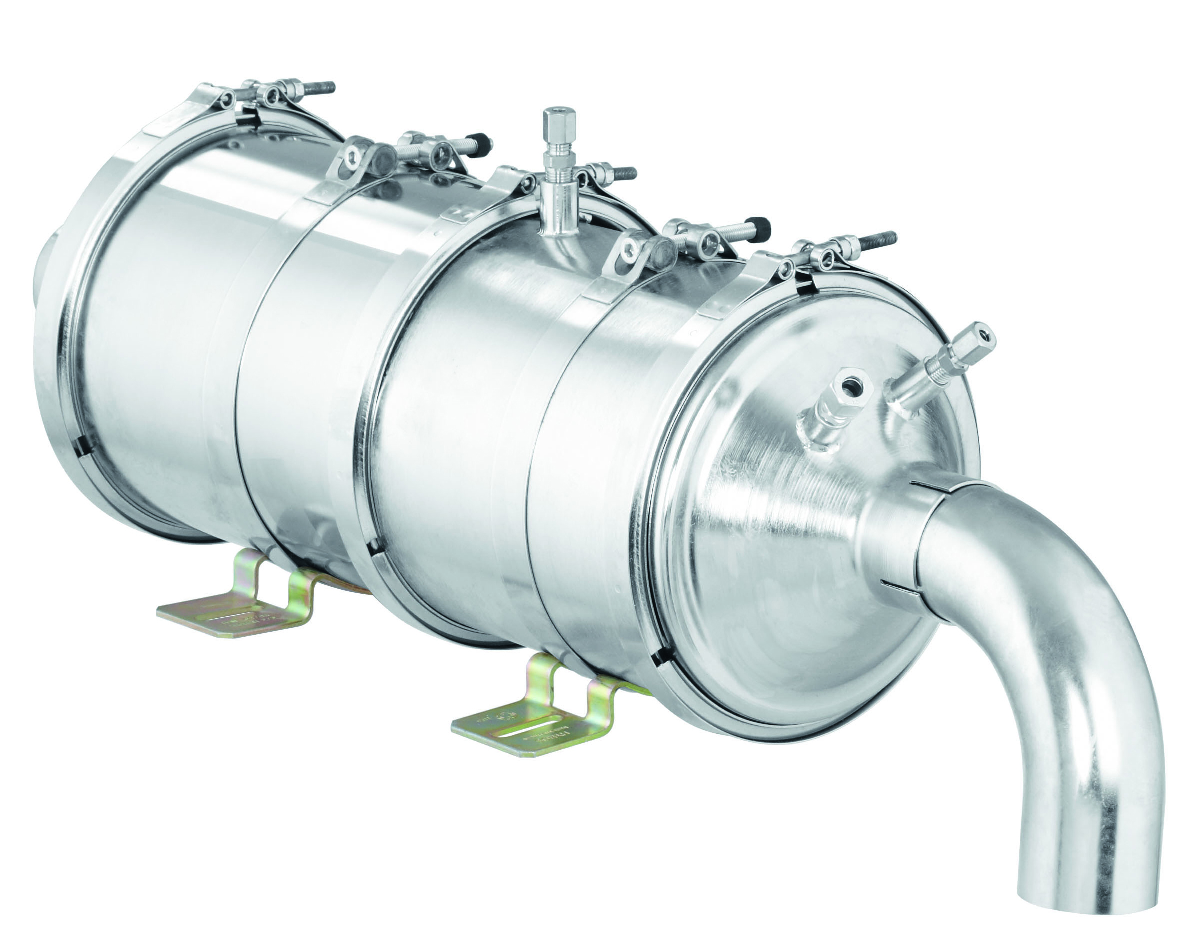
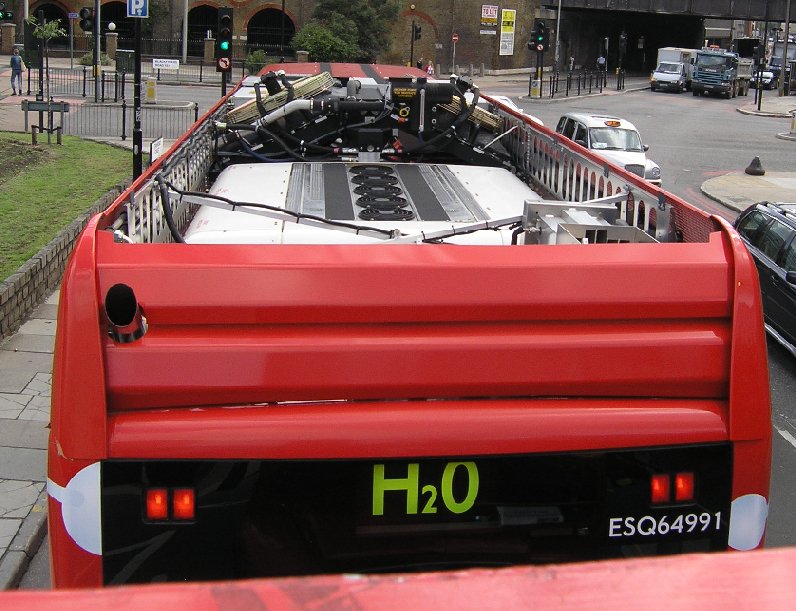
  • Encouraging the very cleanest vehicles. Vehicles with zero emissions (on the road), electric, hydrogen and plug-in-hybrid vehicles. Or vehicles with the very newest vehicles, or diesel particulate filters.
  • Information campaigns about turning the engine off while stationary - no idling - or general information campaigns on air quality levels.

Examples of local measures for sources other than road vehicles:

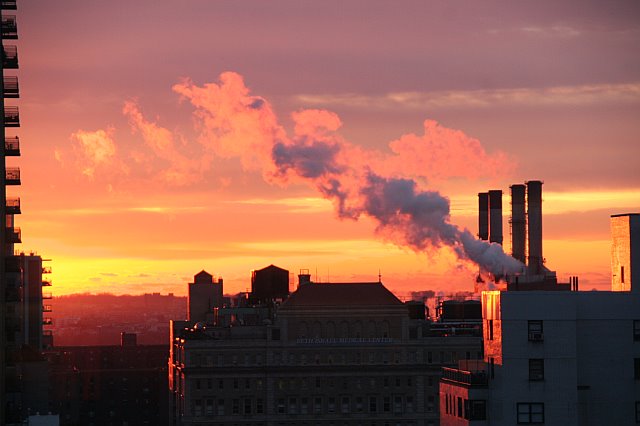
  • Emissions control of factories and power stations
  • Controls on construction sites. For example reducing demolition dust, using cleaner fuels, newer vehicles and fitting equipment like diesel particulate filters on diesel construction machines
  • Improving energy efficiency. Less fuel burned = less emissions
  • Controls on using coal, oil or wood burning
  • Encouraging cleaner heating systems with grant funding and / or requiring heating systems to meet minimum standards.
  • Cleaner service vehicles at airports
  • Electrifying train lines, cleaner train engines and cleaner train diesel fuel


Some measures are specific to some areas. For example in Scandinavia the studded winter tyres used in winter are a particular problem as they create lots of additional dust from the road surface. Specific measures are therefore taken for this studded winter tyres.

Examples of measures often taken at a national level or regional level, include:

  • Financial help (grants or tax incentives) for cleaner vehicles. For example in many countries, efficient cleaner vehicles have cheaper road tax than inefficient dirtier vehicles
  • Legal frameworks to allow or require action at the city level
  • Funding for public transport

The European Union plays an essential role in reducing air pollution, through for example vehicle Euro standards, cleaner road, off-road or shipping fuels, aircraft policies or setting EU Air Quality Standards to protect health.

Measures that need to be taken at an international level, include those for shipping and aircraft. Agreements have been made, for example, to limit the sulphur content of shipping fuels, both generally and in certain shipping areas. Further discussions on shipping and aircraft emissions reductions are being undertaken. These agreements often take longer to happen, as greater numbers of different countries need to agree them.

Low Emission Zones (LEZs) have had a positive impact on air quality in many European cities. They are one of many measures that are implemented in cities to improve air quality. Poor air quality has an impact on our health. Improving air quality improves our health and lets us live longer.

Graph of Berlin LEZ impacts
  Impact Milan Ecopass 
emissions impact Leipzip Low emission zone 4 years Particle number and soot


The impacts of Low Emission Zones are discussed here. See here for the impacts of Urban Road Tolls and Access Regulations.

The level of impact LEZs have on air quality depends on many things, such as

  • the emissions standard set,
  • how well the LEZ is enforced (controlled),
  • which vehicle types are affected,
  • the geographical area of the LEZ,
  • how vehicle operators choose to comply (for example, whether they choose to buy a new vehicle, retrofit a full diesel particulate filter, or buy a second hand vehicle that meets the standard, change fuel type)
  • the vehicle fleet before the LEZ was implemented (for example how old, what types of vehicles and percentage of diesel and petrol vehicles)
  • the importance of different pollution sources in that city
  • how extreme the air quality problems are.

There are various ways to measure the impact of LEZs. Often the emissions of the vehicles in the LEZ are calculated and compared with a calculation for the same situation without an LEZ. Other times the air quality before and after is compared with similar situations. 

You can read more about the EU Air Quality Standards on the EU website that need to be met and air quality health impacts on the World Health Organisation website (we take no responsibility for external websites). These may help explain the information below.

LEZs reduce emissions of vehicles. In particular they reduce diesel particulates. These are pollutants that are confirmed by the World Health Organisation to be carcenogenic (see the WHO agency IARC or United Nations press releases). These particles are part of the pollutant known as PM10, which is has an EU Air Quality Standard. However because diesel particulates are very small and PM10 is measured by mass (weight), the diesel particulates make up a small proportion of the PM10, but a proportionally larger impact on health.

Results from a number of cities are given below:


London Ultra LEZ:

The London Ultra LEZ has reduced NO2 by 32 µg/m3, traffic by 9%, CO2 by 13%

Preliminary results show the amazing success from the first six months of the ULEZ :

  • Roadside NO2 reduced by 32 µg/m3 in the central zone, a reduction of 36%. This is a Huge reduction, when one compares with what other measures bring!
  • NO2 concentrations reduced by 24 µg/m3 at roadside locations in central London, a reduction of 29 %
  • No increased NO2 concentrations since the introduction of the ULEZ on any of the boundary road monitoring stations
  • Road transport NOx emissions reduced by 31% in the central zone 
  • Road transport CO2 emissions reduced by 4% (9,800 tonnes) in the central zone. When compared to 2016, this is 13 % reduction
  • 3 – 9 % reduction in traffic flows in central London 
  • 13,500 fewer older, polluting vehicles entering central London
  • Average compliance rate with the ULEZ standards is 77 % in a 24 hour period (74 % in congestion charging hours)

For more information on the impacts, see the Mayor of London's ULEZ report.

London LEZ:

Some of the results of the impact of the London LEZ are given below.
Please note: the public buses have higher standards than the LEZ. However, as this was achieved through the public bus contracts and not by the LEZ, these impacts are not included in the impacts of the LEZ. The impacts of the buses with less emission is significant, and also given below.

Impacts of the London LEZ:

  • Black Carbon has been reduced by 40-50%
  • NO2:  Average concentrations were reduced by 0.12 μg/m3, peak concentration reductions up to 0.16 μg/m3 on polluted streets.
  • PM10: Average concentrations reduced 0.03 μg/m3, peak concentration reductions up to 0.5 μg/m3 on polluted streets.
  • Emissions of PM10 were reduced by 1.9% (28 tonnes)
  • Emissions of NOx were reduced by 2.4% (26 tonnes)
  • The feasibility study predicted gain of 5200 years of life, and 310,000 fewer cases of lower respiratory symptoms, 30,000 fewer cases of respiratory medication & 231,000 fewer restricted activity days. 
  • The Cost Benefit Analysis gave a £250-670 million benefit, £90-250 of which are outside Greater London.

Impacts of public buses with less emission, done together with the LEZ:

PM10 emissions from TfL buses have reduced by around 90% from 2000-2010 while providing 32% more km travelled, through an extended bus network at the same time. This is equivalent of a reduction of 280%.


Berlin low emission zone impacts:

Berlin has undertaken extensive impact assessments of the LEZ, isolating the impact of the LEZ from other measures and influences.

The LEZ has reduced PM10 exceedences of the EU PM10 air quality standard from 28 to 24 per year, diesel particulate concentrations by 14-22%, & PM10 concentrations by 3% on main roads.

Berlin has reduced 58% of diesel particles, the most dangerous part of particulate matter. A graph of the results in "Reduction of diesel particulate emission" is shown below. The calculations are based on the vehicle fleet of the Frankfurter Allee in Berlin. 

Graph of Berlin LEZ impacts

(if you are viewing this through automatic translation, the words in the title are "Reduction of diesel Particle emission" and in the key are "Trend 2008 no Low Emission Zone" etc).


The emissions of nitrogen oxides (NOx) lead to NO2 in the air. The LEZ has reduced these emissions by 20%.

Impact of Berlins LEZ on emissions of nitrogen oxides

(if you are viewing this through automatic translation, the words in the title are "based on fleet composition at Frankfurter Alle (new emission factor base data HBEFa3.1" and in the key are "Trend 2008 no Low Emission Zone" etc).


Milan Ecopass and Area C impact

Milan has four variations of its low emission zone. One is the regional LEZ (Milano Province): in winter vehicles with a lower Euro standard were banned.
The other scheme is the combined LEZ and Congestion Charge. The Ecopass was replaced by the Area C. With the Ecopass vehicles which entered Milan needed to pay; and vehicles with a lower Euro standard had to pay more. After a number of years the Ecopass did not have a significant impact any more, and so needed to be tightened. The Area C is the tighter scheme that charges vehicles and does not allow the dirtier (high emitting) vehicles access. The minimum standards allowed in the Area C are: diesel vehicles Euro 3, or petrol vehicles Euro 1. The 
 
• When it was implemented the Ecopass improved air quality concentrations by:
       – PM10 annual average 4%, exceedences 13%
• When it was implemented the Ecopass reduced emissions from traffic (as well as traffic flow) by:
        – PM10 19%, NOx 11%, CO2 9%
 
•The Area C has now reduced traffic emissions reduced by:
       – PM10 18%, NOx 10%, CO2 22%
 
Because the Milan schemes are also a congestion charge, they also reduce the number of vehicles travelling into the city. Most 'normal' LEZs do not usually change the number of vehicles entering the zone. This means that the Milan schemes also reduce emissions of CO2, which the other LEZs usually do not.
 
Before the Ecopass was implemented, the 35th day of PM10 exceedence in Milan was on the 35th day of the year. For the first few years after it was implemented the Ecopass pushed the 35th day of exceedence to the end of February - see the graph below.
Graph with the improvements from the Milan Ecopass on PM10 exceedences
The impact on number of days exceeding the PM10 Limit Value of 50μg/m3 in the Ecopass area can be seen in the graph below (blue with Ecopass, red/purple without Ecopass).
Impact of Milan Ecopass on EU PM10 Limit Values
 
The impact on PM10 annual average concentrations in the air of the Ecopass area can be seen in the graph below (blue with Ecopass, red/purple without Ecopass).
Impact of Milan Ecopass on annual average PM10
The impact on the annual emissions of nitrogen oxides (NOx) in the Ecopass area can be seen in the graph below (blue with Ecopass, grey without Ecopass).
Impact of Milan Ecopass on NOx emissions
 
The impacts of the Area C have been
  • Reduction of incoming  traffic of just over 30%
  • During hours of Area C operation, the increase of commercial speed of public transport in the area is 5.7%  for buses and 4.7%  for trams.
  • No evidence the of deterioration in the speed of public transport outside the area
  • Impact on air quality emissions:
    • PM10 exhaust                -19%;
    • PM10  total                    -18%;
    • NH3, Ammonia               -31%;
    • NOx Nitrogen oxides       -10%;
    • CO2 Carbon dioxide        -22%
  • Inside Area C compared to external area the following results for Black Carbon:
    • Concentrations of Black Carbon (BC) from -28% to -43%;
    • Content of Black Carbon in PM10 (ratio BC/PM10) from -16% to -46%;
    • Content of Black Carbon in PM2.5 (ratio BC/PM2.5) from -22% to -46%.
  • Inside Area C compared to external area the following results:
    • Concentrations of Black Carbon (BC) from -28% to -43%;
    • Content of BC in PM10 (ratio BC/PM10) from -16% to -46%;
    • Content of BC in PM2.5 (ratio BC/PM2.5) from -22% to -46%.

Black Carbon is used because:

1) It is one of the most harmful substances to health
2) It comes from road traffic, and is not imported very much into cities from elsewhere. This means that reductions in black carbon in Milan will be from traffic changes. As the Area C is the major traffic change, that will be the main cause of the improvement.


The Netherlands LEZ, in 9 cities:

  • The LEZs started from January 2007. In summer 2008, the actual air quality improvements were slightly less than predicted, with improvements between 0 - 2μg/m 3.
  • The impact was limited by gradual enforcement and the fact that there were many exemptions for vehicles where diesel particulate filters were not available.
  • Both of these were expected to improve and to increase the air quality impact by a factor of 1.5 - 2. The LEZ second phase will also have a greater impact.
  • The Dutch enforcement of the LEZ is more strikt now. After the enforcement campaign: in Den Bosch 83% of lorries complied – up from 70%, in Eindhoven 91% of vehicles complied. Vehicles which did not comply and did not have exemptions must pay a €150 fine. This increased compliance will increase the impact of the LEZ on air quality.


Rotterdam

Rotterdam's LEZ was extended in January 2016 to affect cars and light duty vehicles. It now bans diesel vehicles registered after 1 July 2001 and petrol vehicles and LPG vehicles registered after 1 July 1992.

The impact of this scheme has been to reduce the number of severely polluting cars by half. Before the extended LEZ, of the up to 700 000 vehicles enter Rotterdam, 1.18% were older models with high emissions. Since the extended LEZ this has dropped to 0.66%. The city authorities estimate that this reduces emissions of soot by between 20 and 30 %. 

The proportion of dirty vehicles is likely to reduce further. There is currently no penalty for violating the ban. However, from 1 May drivers there is a €90 fine penalty.

For more information, visit The Eltis website, our Rotterdam page.


Leipzig (Germany)
 

The low emission zone in Leipzig was introduced in 2011 with the green badge (Euro 4 diesel, Euro 1 petrol). The announcement and enforcement of the low emission zone caused an accelerated modernization of the vehicle fleet in the city. Leipzig has the only LEZ in the Saxony region of Germany, as well as the most modern car fleet, due to the LEZ.

The figure below shows the weekly variation of the ultrafine particle number concentration, which corresponds to similar traffic volumes from 2010 (before the LEZ) to 2014. The weekly variation of the soot particle mass concentration is basically identical. The daytime concentration in 2014 was half of that in 2010.

Over the four years of the low emission zone, the highly toxic matter soot and ultrafine particle number concentrations have reduced by 47 and 56%, respectively. This significant reduction was achieved due to the fitting of diesel particle filters to meet the LEZ emission standards. This is similar to the reduction seen in the Berlin LEZ, but using a different assessment method. This strengthens the robustness of both assessments.

Black Carbon is the part of the PM10 that comes from vehicles, and is also the part that is most harmful to health. Black Carbon is also not affected by long range emissions outside the control of the city, which PM10 concentrations are. Source: TROPOS, and Gunter Löschau (Saxon State Office for Environment, Dresden)

emissions impact Leipzip Low emission zone 4 years Particle number and soot

Cologne

  • The LEZ has been in operation since January 2008.
  • Results from the first year of operation show that air quality concentrations in Colognes LEZ have reduced more than the surrounding background. For NO2 by 1.2 μg/m3 (background reduction was 0.5μg/m3), PM10 by 4 μg/m3 and 17 exceedences of the limit value (background reduction 4 μg/m3 and 7 exceedences).


Stockholm

The Stockholm LEZ has been in operation since 1996, and its impact was extensively estimated in 2000. The impact on emissions of particles (PM10) and nitrogen oxides (NOx) are given below.

PM10 emissions                                                                NOx emissions

Stockholm PM10 emissions estimates

        Stockholm NOx emissions estimates

Since 2000, there has been further work in Stockholm to reduce illegal vehicles (those not meeting the standards). Illegal vehicles are now less than 5% of those entering the zone. The contribution of emissions from illegal vehicles will therefore have been reduced.

In looking at the impact on concentrations, the levels of PM0.2 (particles less than 0.2 μm in diameter) have been estimated. These are some of the smallest particles that are of most concern to health. Since diesel particulate exhaust emissions are all PM0.2, they are reduced by the LEZ. The map below represents the estimated percentage reduction in PM0.2 concentrations in Stockholm due to the LEZ.
 Map of Stockholm PM0.2 concentrations with LEZ

As can be seen from the coloured map, emissions reduced differently in different parts of the city. Where the lorry traffic is heavier there is more impact from cleaner lorries. The map shows that concentrations of PM0.2 were reduced by between 0.5 and 9% with the LEZ. If all vehicles had been fully compliant, then the concentrations would have been reduced by between 0.5 and 12%.


Copenhagen

Copenhagen estimated the likely impact of the LEZ in terms of the health impact:

The 1st phase 90 premature deaths less and reduce health costs of 10 million €.
The 2nd phase 150 deaths less, 150 relevant hospital admissions less, 750 bronchitis attacks less, 8,000 asthma attacks less& 90,000 days of restricted activity less.


Non-air quality impacts

• Traffic flows have remained fairly constant. The exception is the Milan schemes, which area a combined congestion toll and LEZ
• Few negative business impacts have been reported. This is despite many impacts being forecast by trade bodies, including job losses. Germany and the Netherlands have ‘hardship’ exemptions. Hardship exemptions were granted if the vehicle operator could prove that they could not afford to change their vehicle to comply with the LEZ. Few of these exemptions have been applied for.
• Gothenburg undertook a survey of hauliers and suppliers on their LEZ, which was fairly positive. 21% of respondents gave the LEZ a good 'overall rating‘, 28% gave it fairly good, and only 20% gave it a negative rating, despite the LEZ affecting their business operation.


Fitting a replacement, cleaner engine


vehicle engine

© Gregory Gerber - shutterstock.com

For some long-life vehicles, replacing the existing engine with one that is of a higher emissions standard may be an option (also referred to as “repowering”). These vehicles might include:

  • specialist vehicles
  • high cost vehicles
  • coaches
  • buses

This may be particularly relevant if the engine needs replacing as part of the maintenance of the vehicle anyway.

To allow entry into a low emission zone, this change to your vehicles emissions will need to be certified. Different countries have different approaches to this. In some countries you may be able to have the change made on your vehicle registration papers, or provide other proof for the low emission zone authorities.

Conversion to an alternative fuel

In some Low Emission Zones, converting the vehicle to an alternative fuel will allow entry into the LEZ.
 
LPG car shutterstock
 
Fuels that can be retrofitted can include:
  • Natural gas (Compressed Natural Gas or Liquid Natural Gas)
  • Liquid petroleum gas
  • Ethanol
  • Electric engine (although this is less frequent).
 
This conversion may also enable the vehicle to have a higher Euro standard, as you would when replacing the engine with a newer diesel or petrol engine. Gas conversions often also have to be certified and you will need to provide some proof to the LEZ authorities.
 
Different countries have different approaches to proof of certified conversions. In London you need to register with the Vehicle Standards Authority (VOSA), see the TfL website. In other countries you may be able to have the change registered on your vehicle papers, or provide other proof for the LEZ authorities. Check with the relevant low emission zone authorities before undertaking the conversion.

In many countries alternative fuels can be cheaper (due to reduced fuel tax), although there can be significant costs to the conversion itself.
Ethanol or Biogas conversions are more widely used in Sweden than elsewhere. 
Due to their zero emissions while driving, electric and hydrogen vehicles are also generally allowed in LEZs as well as other access regulations. However, these are more likely to be new vehicles than converted vehicles.

When considering retrofitting your vehicle, it is important to make sure that you get the right retrofit to allow you entry into the Low Emission Zones you need.

Diesel particulate filter 
Picture Source


Which Countries allow Retrofitting?

More information is available from the pages on the individual LEZs, and each LEZs' own websites, but in general in terms of fitting particulate filters:

In Austria you can retrofit some lorries with a particulate filter to meet the emissions standards. Find out here which companies offer retrofitting in Austria.

In Germany you can retrofit to Euro 2, 3 or 4 with a particulate filter. Find out here which companies offer retrofitting in Germany.

In Belgium Euro 3 diesel vehicles with a particulate filter can enter until 2019 (after registration). Find out here which companies offer retrofitting in Belgium.

In the Netherlands since July 2013 the full Euro 4 standard is required to access to the environmental zones, and retrofitted vehicles are no longer allowed. More information (in Dutch). Find out here which companies offer retrofitting in the Netherlands.

In Londonvehicles can be retrofitted as long as the retrofit device is certified as meeting the required emissions standard of Euro 4 in 2012. Only full filters are certified in London. Find out here and here which companies offer retrofitting in London.

In Denmarkparticulate filters should be fitted on Euro 3 or earlier vehicles after 2010. Only full filters are certified in Denmark. Find out here which companies offer retrofitting in Denmark.

In most Italian low emission zones particulate filters can be fitted to allow access. However, this depends on the individual city. Find out here which companies offer retrofitting in Italy.

In Sweden retrofitting is allowed if you meet fit both a particulate filter and SCR to meet the required standard. Find out here which companies offer retrofitting in Sweden. 


When considering retrofitting your vehicle, it is important to make sure that you get the right retrofit to allow you entry into the Low Emission Zones you need.

Diesel particulate filter 
Picture Source


Which Countries allow Retrofitting?

More information is available from the pages on the individual LEZs, and each LEZs' own websites, but in general in terms of fitting particulate filters:

In Austria you can retrofit some lorries with a particulate filter to meet the emissions standards. Find out here which companies offer retrofitting in Austria.

In Germany you can retrofit to Euro 2, 3 or 4 with a particulate filter. Find out here which companies offer retrofitting in Germany.

In the Netherlands since July 2013 the full Euro 4 standard is required to access to the environmental zones, and retrofitted vehicles are no longer allowed. 

In Londonvehicles can be retrofitted as long as the retrofit device is certified as meeting the required emissions standard of Euro 4 in 2012. Only full filters are certified in London. Find out here and here which companies offer retrofitting in London.

In Denmarkparticulate filters should be fitted on Euro 3 or earlier vehicles after 2010. Only full filters are certified in Denmark. Find out here which companies offer retrofitting in Denmark.

In most Italian low emission zones particulate filters can be fitted to allow access. However, this depends on the individual city. Find out here which companies offer retrofitting in Italy.

In Sweden retrofitting is allowed if you meet fit both a particulate filter and SCR to meet the required standard. Find out here which companies offer retrofitting in Sweden. 

Existing vehicles can be fitted with devices to reduce their emissions, often called retrofitting. 'Diesel particulate filters can be fitted to reduce particle emissions and selective catalytic reduction for NOx emissions.

These are possible to be used to meet the emissions standards in some countries, see here.

Diesel particulate filter

Picture © puritech

Diesel particulate filter (DPF) and Selective Catalytic Reduction (SCR)

Many low emission zones have a emissions standard set, for example the particulate aspect of Euro 3. This can allow existing vehicles to fit diesel particulate filter (or 'retrofitt') to reduce the particulate emissions to meet the emissions standards.

Certified retrofit devices should be used, to make sure that they work properly. Each country that allows retrofitting for the low emission zones has filters that are certified; make sure the filter you fit is certified in the country you are based, or want to travel. The manufacturers and garages will know which ones are certified.

Diesel particulate filter
A diesel particulate filter (also known as DPF or particulate filter, or sometimes referred to as “pollution abatement device”) is a device that reduces the diesel particulate matter or soot from the exhaust gas of a diesel engine. They can be fitted to vehicles in the factory to new vehicles, or once they have been on the road (retrofitted).
 
DPFs for cars can usually improve the emissions standard by one. Some DPFs for heavier vehicles can increase emissions more, as they can achieve higher emissions reductions.
 
In summary, they filter the exhaust and the particulate matter is trapped within the filter. There are two main types of filter:
  1. A ‘full’ DPF, which will reduce particulate emissions between 85% and 99%. They are also very effective at reducing emissions of the very smallest particulates which are of greatest concern to health. They are usually only available for new vehicles from the factory or to retrofit heavy duty vehicles.
  2. A ‘partial’ filter, which reduces emissions between around 30% and 50%. They tend not to reduce emissions of the smallest particles as effectively as for the larger particles, but are available to retrofit light duty vehicles.


If you decide to fit a filter, it is important to get one that is correctly chosen both for your vehicle and vehicle usage, and is certified for the LEZ(s) you wish to travel in.

The company or agency providing or fitting your filter should be able to advise you for the right equipment for your vehicle and vehicle usage. For the environmental and health impact, a full particulate filter is a much better option - and will also give access to more LEZs for longer.

In some countries there are also financial incentives to support the retrofitting of particulate filters.


Selective Catalytic Reduction (SCR)

This is technology that can be fitted to existing vehicles to reduce emissions of oxides of nitrogen (NOx) by up to 70%. 

SCR is fitted together with a DPF and is becoming more common and is being used extensively in London to improve bus emissions. Both SCR and DPFs are required to be retrofitted to enable older heavy duty vehicles to go into the LEZs in Sweden

What emissions is my vehicle 
  Find vehicle emission standard car door 
Find vehicle emission standard vehicle papers

Euro standards are the main way of classifying vehicle emissions. Without the right emissions standard, you can not enter over 200 European cities in 12 countries. Find out where by country or city.

There are a number of different ways to identify a vehicles emissions standard:
National Euro standard websites
Vehicle registration papers
Vehicle engine / door frame
Other ways of identifying emissions standard
Incentives for lower emitting vehicles
What do I do if my diesel vehicle does not meet the standard?
Vehicle Euro standards


National Euro standard websites

If your vehicle is registered in the countries below, you can check your emissions standard online (see the links)

Vehicle registration papers

In many countries this information is on the vehicle registration papers. See below for an example from Germany. The Euro standard is circled in red.

Find Euro standard on vehicle papers

Car Door Frame

It can also often be found on the car door frame. See the photo below.

 Find vehicle emission standard on car door frame

For lorries, coaches and buses, the engine and frame are often made separately.


Other ways to find out what your vehicle Euro standard include:

  • For newer vehicles, the Euro emission standard may be listed on the registration documents. In the UK this is in the V5C (V5C registration certificate, or log book in section D.2).
  • On some vehicles the Euro standard is on the inside of the (passenger or driver) door frame (when you open the door, look on all the surfaces of the door frame).
  • Your local dealer or manufacturer should be able to provide the information. It is useful to provide the dealer or manufacturer with as much information as possible about the vehicle, including the chassis number and engine number.
  • For lorries and coaches, where the body and engine are often manufactured separately, the vehicle engine details are very important when contacting the manufacturer for the Euro standard.

Otherwise, the vehicle age and type will tell you the Euro standard for most petrol or diesel fuelled vehicles. See the section below on emission standards


Most countries also give other incentives for lower emitting vehicles

This can be for example cheaper

  • road tax
  • motorway tolls,
  • congestion charging,
  • parking to cleaner vehicles, or electric vehicles.


What to do if your diesel vehicle does not meet the standards?

If your diesel vehicle does not meet the standards, you may be able to fit your vehicle with a diesel particulate filter. The particulate filter reduces emissions from the vehicle. After fitting a particulate filter a many low emission zones allow you in the zone.

Diesel particulate filter vehicle engine

© puritech, © Gregory Gerber - shutterstock.com

Vehicle Euro Standards

The 'Euro' emissions standards are developed by the European Commission. They have greatly helped to reduce pollution. Many cities use these Euro standards to keep the older, more polluting, vehicles out of the cities. These are often called low emission zones. Find out where the low emission zones in Europe are though our city search, or with our map). 

Every 4 to 5 years a new Euro standard has ensured that the vehicles sold have lower emissions. The timings of these standards by vehicle type are given in the table below. This gives a guide to what emissions standard each type of vehicle will be, depending on when it was manufactured, as a guide only.

All dates listed in the tables refer to new type approvals (i.e. new vehicle models). Around one year is the date when vehicles are no longer allowed to be first registered if the do not meet the standards.


Emissions standard dates for new vehicle models


Euro 1

Euro 2

Euro 3

Euro 4

Euro 5

Euro 6

Euro 6d 

Passenger cars

July 1992 

Jan 1996

Jan 2000 

Jan 2005

Sept 2009

Sept 2014

Sept 2020

Light commercial vehicles (N1-I) ≤1305kg

Oct 1994 

Jan 1998

Jan 2000

Jan 2005

Sept 2010

Sept 2014

Sept 2020

Light commercial vehicles (all others)

Oct 1994

Jan 1998

Jan 2001

Jan 2006

Sept 2010

Sept 2015

Sept 2021

Lorries and buses

1992

1995

 1999

2005

2008

 2013

Sept 2018

 Motorcycles

2000

2004

2007

 2016

 2020


 Mopeds

2000

2002


 2017

 2020


The dates above give an approximate guide to Euro standards of vehicles.

  • The dates given above are when all new vehicle models have to meet the standards. Around one year is the date when vehicles are no longer allowed to be first registered if the do not meet the standards (Except lorries and buses Euro 6d which is 3 years later).
  • Some vehicle models were released before the dates below, so met standards earlier than they were legally required to. 
  • Other vehicles may have a newer engine than the vehicle was manufactured with.
  • A few small production models were given extensions, so will met the standards later. 
  • There are other phases of Euro 6/VI, eg Euro 6a, Euro 6e, Euro VI-E which have different testing conditions, but so far these have not been used in LEZs with the exception of Euro 6d-Temp, registered latest 2019. 
  • Euro 7 is planned to come in from 2025, but is still in planning.

Your vehicle papers, or the links above, may give more accurate information. In some countries the more accurate data is not available for all vehicle types, and an estimation is made using the dates below, or sometimes other data from the vehicle manufacturers.


RDE is 'Real world Driving Emissions', which is a test brought in to ensure that vehicle emissions are reduced in the real world, not just in the test lab. The vehicle will be driven outside and on a real road according to random acceleration and deceleration patterns.  New vehicle models must meet it from September 2017, and it will be tightened in September 2019.

The emission standards for an EEV are between Euro 5 and 6.

This page on the European Commission website gives more information on the Euro standards. Dieselnet also gives information on world-wide diesel and petrol vehicle emissions standards.

The first step is to find out if the city you wish to visit has a low emission zone, and what emissions standard it has. This can best be done by our City Search on the home or many other pages, our map or by Country. For more details on using our website see how to best use this site.

Vehicle exhaust
Diesel-particulate-filter-puritec
  Car with German low emission zone sticker

Then find out the emissions standard of the vehicle you wish to use.

For some low emission zones retrofitting with a diesel particulate filter or Selective Catalytic Reduction (SCR) is possible so that your vehicle meets the standard. 

Some low emission zones require you to register your vehicle, buy a sticker, pay a charge or otherwise register before you drive in the zone. You will need to proof of the emissions standard.

If you travel to many cities in Europe, check what emissions standards are required in the different LEZs, so that you choose a vehicle that will allow you to drive into the cities you need. If you travel often to different countries, and you want to get an overview of the different standards in different countries, then This email address is being protected from spambots. You need JavaScript enabled to view it..

If your vehicle does not meet the standards required, then you need to do one or more of the following:

Buy a newer vehicle
Retrofit
Reorganise your fleet or journey
Check for Exemptions


Buy a newer vehicle

Use a newer vehicle with an engine which meets the LEZ emissions standards, either a new vehicle, or a newer vehicle that meets the standards.

Vehicles in Europe since 1992 have been built to "Euro standards". These means that every 4-6 years, new vehicles are built with cleaner standards. The standards are currently between "pre-Euro" or "Euro 0" (meaning before the standards), and Euro standards 1 to 6. There are a number of other emissions standards, such as "EEV, Environmentally Enhanced Vehicle". The "Euro standards" are sometimes referred to as Euro I to VI for heavy duty vehicles, and Euro 1 to 5 for light duty vehicles. On this website we call them Euro 1 to 6 for both heavy and light duty vehicles to make it simpler.

If you have a choice, select the cleanest engine of the highest Euro standard, as this will also meet future LEZ standards. The Emissions Analytics EQUA Air Quality Index allows you to identify the vehicle with the lowest fuel use, CO2, or nitrogen oxides (NOx) emissions in actual road conditions.


Retrofit

For most LEZs and many vehicles, it is possible to fit equipment to reduce its emissions or modify the vehicle to reduce its emissions.

Possible modifications include:

The LEZ will usually require proof that a certified particulate filter has been fitted.

Diesel particulate filter vehicle engine


Picture sources, Puritec & Shutterstock

Reorganise your fleet or journey

If you operate a fleet of vehicles, you may be able to plan so that only vehicles that meet the LEZ emissions standards are used within the LEZs. If you are a small operator, then arrangements with other firms that have vehicles that comply can be an option.
Some cities may have distribution centres that you may be able to use to help avoid travelling into the LEZ area, also saving fuel, time and money.
If light duty vehicles are affected by the LEZ,  then you may be able to use public transport to reach your destination.
 

Exemptions

Some specialist vehicles may be exempt from the LEZ based on their use or type, for example registered disabled person vehicles, historic vehicles or circus vehicles. The vehicle will often be required to be registered with its local Registration Authority as this special vehicle type.
Some schemes allow entry of vehicles that do not meet the emissions standards if they pay a road toll and/or get a special permit under certain conditions.
Check with the individual LEZ city page on this website for more details.

Low Emission Zones (LEZs) are areas where the most polluting vehicles are regulated. Usually this means that vehicles with higher emissions cannot enter the area. In some low emission zones the more polluting vehicles have to pay more if they enter the low emission zone.

There are increasing numbers of Zero Emission Zones in operation, preparation or planning. These are zones where only Zero Emission Vehicles are allowed in. This means Battery Electric or Hydrogen Fuel Cell Vehicles. For some plug-in hybrid vehicles may be allowed entry for an interim period, together with geofencing.

German Low Emission Zone Road Sign 
London fuel cell bus and taxi 
  French German Low Emission Zone Stickers

This page answers three key questions about Low Emission Zones 


What are Low Emission Zones?

Low Emission Zones (LEZs) are areas where the most polluting vehicles are regulated. Usually this means that vehicles with higher emissions cannot enter the area. In some low emission zones the more polluting vehicles have to pay more if they enter the low emission zone.
Low Emission Zones are also known as:

  • Environment Zones,
  • Umweltzonen (Germany),
  • Milieuzones (Netherlands),
  • ZCR, Zone à Circulation Restreinte (France)
  • Lage-emissiezone (Belgium)
  • Clean Air Zones (England)
  • Miljøzone (Denmark),
  • Miljözon (Sweden),
  • Lavutslippssone (Norway),
  • Alacsony Kibocsátási Övezet (Hungary),
  • ZTL ambiente (Italy).

Low Emission Zones are often the most effective measure that towns and cities can take to improve air pollution. Low emission zones reduce emissions of fine particles, nitrogen dioxide and (indirectly) ozone. These are the three main air pollutants of concern in Europe.
Fine particulates are also known as PM10 (particulate matter less than 10 micrometre in diameter) or PM2.5 (particulate matter less than 5 micrometre in diameter). A micrometre (μm) is a millionth of a metre (A human hair is about 90 µm in diameter). These fine particulates enter our bodies through its defences and cause damage to our hearts and lungs.

Vehicle emissions are classified in Europe by the "Euro standards". In some LEZs fitting a diesel particulate filter can allow a vehicle access to a LEZ.

Before you travel into a low emission zone, you first need to find out if your vehicle is affected.

  • Most low emission zones affect buses and coaches
  • Most low emission zones affect heavy duty goods vehicles (usually over 3.5 tonnes Gross Vehicle Weight (GVW))
  • Some LEZs also affect
    • vans, minibuses, camper vans
    • cars and
    • motorcycles

Find out which vehicles are affected in the city you wish to enter through our city search (above, in the top part of this page, under the menus).

Next you need to find out the emissions standards of your vehicle. Then check if this emissions standard is allowed into the zone.

Most LEZs operate 24 hours a day, 365 days a year. The largest exception to this is some of the Italian LEZs which are not in operation permanently. However, this number is reducing.


Why Low Emission Zones?

LEZs are implemented in areas where air pollution levels are dangerous to health. LEZs improve the air quality and make it safer to breathe.

Air pollution can lead to poor health and to death. It has huge costs, in both health and money:

  • Air pollution is responsible for 310 000 premature deaths in Europe each yeari.
  • Air pollution causes more premature deaths than road accidents.
  • The human health damage from air pollution is estimated to cost the European economy between €427 and €790 billion per yeariii.

Air pollution most affects the very young and the old and those with heart and lung diseases. Heart and lung diseases are both common causes of death in Europe.  Air pollution also triggers health problems like asthma attacks and increases hospital admissions and days off sick.

Diesel emissions have been classified as carcinogenic (causing cancer) by the World Health Organisation, which means that reducing diesel emissions is especially important for health. You can find out more details on these issues from the World Health Organisation air quality pages.

We can also consider the impact of air pollution on life expectancy [how long people can expect, on average, to live].

The following map left hand map shows an estimate of how many months life expectancy was reduced by man-made fine particles across Europe in 2000. The right hand map shows the months estimated when the many measures for air pollution have been implemented, in 2020iv. This shows the improvement that can be achieved with different air quality measures, for example cleaner Euro standards and Low Emission Zones.

lives lost from man made PM2.5 in Europe in 2000 and 2020

© European Environment Agency (EEA)

The third map below shows the estimated years of life lost (YOLL) in 2005 attributable to long-term PM2.5 exposurev. This shows slightly different things, but gives a guide to the improvements from the year 2000 above.

Estimated years life lost from long term PM2.5 exposure in Europe

© European Environment Agency (EEA)

Because of this danger to health, many countries around the world, as well as the European Union (EU), have set air quality standards. These usually include concentration limits to be met by set dates. It is in order to help meet these EU Air Quality Standards that low emission zones are being implemented.

There are many other measures that cities, countries and the European Union are taking to improve air quality in Europe. Traffic is one of the main pollution sources in towns and cities. Low Emission Zones are one of the key ways cities can reduce emissions from road traffic.


Why Zero Emission Zones?

Zero emission zones (ZEZ) are implemented for two main reasons; reducing local pollution and reducing climate emissions. They can also contribute to a nice quality of life within, and to a certain extent also outside, the zone. Where there is significant amounts of renewable energy available, electric or fuel cell vehicles can use less energy than most conventional vehicles. This is particularly for heavily used urban vehicles (such as delivery vehicles), where any increased resources required for the zero emission vehicle are more quickly compensated for. Zero emission vehicles are also quieter and have no local pollutants.

There are two main ways of implementing a ZEZ, either removing the traffic, or removing the vehicle's internal combustion engine (petrol, diesel, gas engine). Often it is a combination of both, trying to reduce vehicle traffic, and those vehicles that are allowed entry need to be zero emission vehicles (ZEVs). A pedestrian zone where the vehicles allowed in are zero emission would be one type of ZEZ. Another might be a low emission zone having the standards tightened to become a zero emission zone.

Some ZEZs, for example in the Netherlands, are ZEZ-logistics, where the delivery vehicles need to be zero emissions. This focuses the requirements on the heavily used urban vehicles.


What are Emergency Smog Schemes?

In some cities, when high pollution is expected, or after a certain number of days of high pollution, there are restrictions on vehicle usage, often combined with restrictions on solid fuel burning (eg wood or coal fires).

We have information on most of these schemes on our city pages. Information on whether the scheme is in place or not can be found on the links from our city pages, also in the local radio, newspapers and city websites.

Well known schemes include the Stuttgart Feinstaub Alarm (now no longer in operation) or the city and regional schemes in France and northern Italy.


Further Information on Air Quality

Useful sources of further information on air quality include:

The World Health Organisation

The European Environment Agency

European Commission Air Quality page


Impacts of urban road charging have been looked at for a higher proportion of schemes than for other types of scheme. This is maybe because road tolling is often a more controversial measure. The results for a number of cities are given below.


Impact of Milan's Area C from the start to 2015 
Impact London Congestion Charge 
Impact Gothenburg city road toll congestion tax

Impacts of the following cities can be found below.

London  
Milan   
Stockholm
Gothenburg

London

The London road tolling scheme has been very effective. Before the introduction of the Central London Congestion Charge there was significant traffic congestion in central London. Over half of the time spent by vehicles in central London during the daytime, the vehicles were either stopped in traffic or travelling less than 10km/h. This is about the same speed as in the days of horse and cart!

Those that needed to drive in the area to deliver goods had difficulty to access the area, and required longer or more vehicles and drivers than they do now. This congestion was very expensive for those needing to drive in the central London.

For example the impacts of the Central London Congestion Scheme include:

  • Congestion reduced by 30%, and the volume of traffic reduced by 15%.
  • The proportion of time that drivers spend stationary or moving slowly in queues reduced by up to one-third. This means that journey times are not only shorter, but also more reliable and more predictable – particularly for buses.
  • Traffic entering the zone was reduced by 18%, traffic circulating the zone was reduced by 15%.
  • Bus usage was increased by 38%, with 23% more public transport provided, due to there being more space on the roads.
  • Surveys of Londoners ‘on-street’ suggest that beneficial effects on environmental quality are being recognised
  • The reduction in traffic and its smoother operation reduced traffic emissions of nitrogen oxides (NOx) and Particulate Matter (PM10) by 12% in the zone. The impact on the ring road were less than plus/minus 2%
  • CO2 emissions were reduced by 19%, fuel by 20%
  • Traffic on the ring road surrounding the charging area (where traffic is not charged) showed small reductions in congestion, reflecting better operational management, despite slightly higher traffic flows caused by the charging scheme.
  • No significant negative impact was identified on business and economy.

The impact can be seen graphically below.

Impact London Congestion Charge


Milan

Milan has had three variations of its low emission zone. One is the regional LEZ (Milano Province), and the other two are the combined LEZ and Congestion Charge, first called Ecopass and then Area C.
With the Ecopass vehicles payed according to their emissions, together with the regional LEZ that did not allow the more polluted vehicles to access during the winter. The Area C charges a flat rate for vehicles, but does not allow diesel vehicles to go into the city with a lower Euro standard than Euro 3, or petrol Euro 0.
 

The impacts of the Area C have been

  • Reduction of incoming  traffic of just over 30%
  • During hours of Area C operation, the increase of commercial speed of public transport in the area is 5.7%  for buses and 4.7%  for trams.
  • No evidence the of deterioration in the speed of public  transport  outside the area
  • Impact on air quality emissions:
    • PM10 exhaust                   -19%;
    • PM10  total                        -18%;
    • NH3, Ammonia                    -31%;
    • NOx Nitrogen oxides         -10%;
    • CO2 Carbon dioxide           -22%
  • Inside Area C compared to external area the following results:
    • Concentrations of Black Carbon (BC) from -28% to -43%;
    • Content of BC in PM10 (ratio BC/PM10) from -16% to -46%;
    • Content of BC in PM2.5 (ratio BC/PM2.5) from -22% to -46%.
  • Inside Area C compared to external area the following results:
    • Concentrations of Black Carbon (BC) from -28% to -43%;
    • Content of BC in PM10 (ratio BC/PM10) from -16% to -46%;
    • Content of BC in PM2.5 (ratio BC/PM2.5) from -22% to -46%.


The Area C traffic data from 2015 can be seen in this graph published by the Milan City Authority. The months of the year are shown on the bottom legend, traffic on the left hand side. Click on the graph for a larger version.

Impact of Milan's Area C from the start to 2015

The Area C, designed to reduce traffic, has achieved its goal, leading to a reduction of 41000 entries per day into the Area C area and has also allowed the City Administration to reinvest into sustainable mobility. Over €13 million, net of the costs of running the service (running costs €7,100,000), was allocated to the expansion of subways, trams and buses and the implementation of the second phase of bike sharing in Milan (BikeMi).

€10 million has been used to improve public transport. 15 surface lines could be supercharged throughout the city, including trams and buses. Journeys were increased to more than 250 journeys per day, and the frequency of all subways (to 32 per day), extended during rush hour (extended to 10 a.m. instead of 9am). Moreover, an additional €3 million were used for BikeMi, and there are were 3300 bikes in circulation in 2012.

In addition, between 2012 and 2015: almost €4 million was used for interchange parking in Comasina, €3 million for 30 kph zones and up to €20 million to build and redevelop cycle lanes and cycle paths.

From its start to 2012 the Area C has raised over €20,300,000. Of the payments, 48% were paid for by paper permits and pay and display machines, 30.4% by Telepass, 12.5% by Pin enabled on www.areac.it, to 8.5% from activations of Rid (possible until September 2012) and 0.6% by ATMs.

The previous Ecopass improved air quality concentrations by:
– PM10 annual average 4%, exceedences 13%
• The Ecopass reduced emissions from traffic (as well as traffic flow)
– PM10 19%, NOx 11%, CO2 9%
 
• During Area C operation 7:30-19:30 traffic emissions reduced by
– PM10 18%, NOx 10%, CO2 22%
 
Because the Milan schemes are also a congestion charge, they also reduce the number of vehicles travelling into the city, unlike most other LEZs, which do not change the number of vehicles entering the zone. This means that they also reduce emissions of CO2, which the other LEZs generally do not.
 
Before the Ecopass, the 35th day of the year was also the 35th day of PM10 exceedence in Milan. After the Ecopass this was pushed that back to the end of February - see the graph below.
Graph with the improvements from the Milan Ecopass on PM10 exceedences
The impact on number of days exceeding the PM10 Limit Value of 50μg/m3 in the Ecopass area can be seen in the graph below (blue with Ecopass, red/purple without Ecopass).
Impact of Milan Ecopass on EU PM10 Limit Values
 
The impact on PM10 annual average concentrations in the air of the Ecopoass area can be seen in the graph below (blue with Ecopass, red/purple without Ecopass).
Impact of Milan Ecopass on annual average PM10
The impact on the annual emissions of nitrogen oxides (NOx) can be seen in the graph below (blue with Ecopass, grey without Ecopass).
Impact of Milan Ecopass on NOx emissions
 
Stockholm Congestion Charge
 
Stockholm first introduced a trial congestion charge, which was determined to be successful. Following the trial the city had a referendum on whether the congestion charge should become permanent. The referendum chose for a congestion charge.
 
The impact of the permanent congestion charge in Stockholm was found to be:
In 2008 the reduction of traffic across the tax cordon was 18%, compared to 2005, before the introduction of the congestion charge, or its trial.
The charge has led to a rapid increase in the number of exempted alternative fuel vehicles in the Stockholm areas. The proportion of trips made by alternative fuel vehicles has increased from 3% during the trial to 13% in 2008.

Estimates are that emissions of CO2 from motor vehicles in the inner city fell by between 14% and 18% as a result of the congestion charge/tax.


Gothenburg

Gothenburg (half a million inhabitants in Sweden) introduced a congestion charge in 2013, and has reduced traffic by around 12% during the week daytime, when the charge is in place.

Impact Gothenburg city road toll congestion tax

Diagram: Weekday traffic volume (6 a.m. to 6:30 p.m.) in the Gothenburg charging zone before and after congestion pricing. (Transportation Research Part A)

Commuters also found their travel times reduced:

Gothenburg city congestion charge commuter travel times reduced

Diagram: Travel time reduction since congestion implementation during weekday morning rush hours in Gothenburg. (Transportation Research Part A)

Find further information on Gothenburg's traffic reduction the citylab website, or from the scientific paper)

Page 2 of 3

Milan
Paris
Brussels
Amsterdam
SUBSCRIBE TO OUR NEWSLETTER
Subscribe to newsletter